


Accueil > Nos Actions > Références & Supports > Supports Pédagogiques & Techniques > Les glaciers islandais
The alarming conclusion of recent research is that Iceland’s glaciers may have less than two centuries left. This seems incredible, given that they are so huge.
Iceland’s shrinking glaciers
Helgi Björnsson demonstrated how their rapid demise results from a positive feedback loop or
Or
Métal précieux. Dans le cadre du séjour Le TrésOR des MINES nous chercherons de l’or dans le Val d’Anniviers, à la batée.
vicious circle : the smaller these ice caps get, the faster they will shrink. Understanding this depends on a concept known as the Equilibrium Line Altitude (ELA).
Above the ELA, more snow and ice accumulate on the glacier in the winter than are lost in the summer. The opposite is true beneath the ELA, which is known as the ablation zone. As long as the area above the ELA is large enough to collect enough snow to replace the ice lost beneath it, the glacier will be stable. With rising global temperatures, the ELA is rises, the glaciers lose more ice than can be replaced by annual snowfall, and they shrink. But this alone doesn’t explain the rapid shrinking.
Björnsson and colleagues have mapped the bedrock surface beneath Iceland’s glaciers using ground-penetrating radar. This is how we know, for example, that Katla’s glaciers are 500 m thick. But this means that the surfaces of the glaciers are only above the ELA because of the ice itself. For example, 65% of the area of Vatnajökull is above the ELA, but only 20% of the bedrock is. As glacier shrinks, the surface altitude of the ice decreases, which reduces the area above the ELA, which makes the glacier shrink faster and so it continues.
There are equations that show how snow is compacted into ice. There are equations that show how glaciers flow under their own weight. There are equations that show how ice melts at lower, warmer, elevations. Combining these with the surface shapes of the glaciers, the radar maps of the bedrock and estimates of future climate (2°C increase by 2100), Björnsson and colleagues modelled the glaciers to see how they would change shape in the future. They concluded that they would be mostly gone in 150-200 years.
The disappearing ice was a theme in other glaciology talks and even in other sessions. Another glaciologist, Thorsteinn Thorsteinsson showed the results of 25 years of monitoring the Höfsjökull glacier, during which period it has lost 6.5% of its mass. The summers of 1991 and 2010 were particularly bad for the glacier, when a coating of fresh volcanic ash caused extra melting. Over in the geodynamics session, Thóra Árnadóttirpresented results from GPS stations that are looking for tiny movements of the land surface caused by plate tectonics or Or Métal précieux. Dans le cadre du séjour Le TrésOR des MINES nous chercherons de l’or dans le Val d’Anniviers, à la batée. volcanic activity. Every station that they put on the mountains poking through the glaciers (nunataks) shows a strong upward motion. This is caused by the land rising as the weight of the ice disappears, and is something to bear in mind when looking for signs of inflation at ice-covered volcanoes.

Gígjökull - an outlet glacier from Eyjafjallajökull. Photo : Ólafur Ingólfsson, 2004.
Icelandic glaciers and climate
Iceland is a glaciated country. Approximately 11% of Iceland’s total area of roughly 100.000 km2 is covered by glaciers (Figure 1). The largest ice caps in Iceland are located in the southern and central highlands.
Figure 1. Major ice caps on Iceland
The distribution of glaciers on Iceland reflects topography, temperatures and precipitation. Glaciers form where mean annual temperatures are below 0°C, and where winter precipitation in the form of snow surpasses summer melt. Mean annual temperatures in the coastal areas around Iceland lie everywhere well above 0°C (Figure 2), but are generally below that in areas above 600-700 m a.s.l. (above sea level) This means that glaciers are located in highlands and mountainous areas, with high precipitation.

Figure 2. Mean annual temperatures on Iceland. Figure source : Veðurstofa Íslands.
Precipitation is highest in the south-eastern part of the country, where it surpasses 4000 mm water equivalents per year (Figure 3). Precipitation in the central and northern Iceland is at places less than 600 mm. This is reflected in the altitude of the glaciation limit (Equilibrium Line Altitude, ELA), which rises from about 1100 m a.s.l. in the south to over 1700 m a.s.l. in the North.
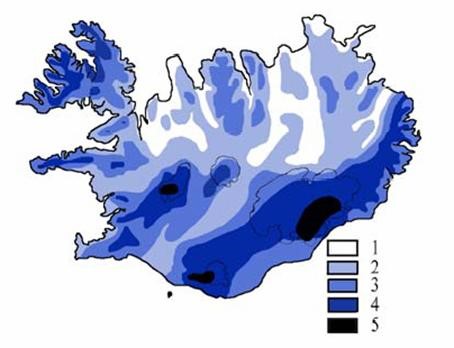
Figure 3 : Mean annual precipitation in Iceland for the period 1931-1960 : 1. < 600 mm ; 2. 600 – 1199 mm ; 3. 1200 – 1999 mm ; 4. 2000 – 3999 mm and 5. > 4000 mm.
Classification of Icelandic glaciers
The Icelandic ice caps, with their numerous outlet glaciers, are wet-based and temperate. This means that they are at the pressure melting point throughout the ice mass and during the whole year (except for the surface layers in winter). The largest ice cap is the great Vatnajökull (Figure 4), the largest glacier mass in Europe. It covers an area of roughly 8000 km2, and is 950-1000 m where it is thickest. Its mean thickness is a little less than 500 m, and the total ice volume of Vatnajökull is probably in the order of 3300 km3. The ELA lies at ca. 1100 m a.s.l. along its southern margins, at 1200 m along its western part, and at 1300 m in its northern part. About 60% of the glacier surface is above the ELA. The ice cap covers a highland plateau, generally reaching 600-800 m altitude, but dissected by numerous broad and narrow subglacial valleys. A number of large volcanoes are covered by the great ice cap, including Öræfajökull (2119 m), Bárðarbunga (2020 m) and Grímsvötn. Other ice caps that centre on great central volcanoes are Mýrdalsjökull (1500 m) and Eyjafjallajökull (1660 m) (Figure 5) as well as Hofsjökull (1760 m) (Figure 6). Langjökull (1360 m) rests on volcanic highlands of the western volcanic zone of Iceland, mainly hyaloclast ridges of Pleistocene age (Figure 6). While the Icelandic ice caps generally centre on highland areas and large mountains, outlet glaciers descend towards the lowlands where they terminate. Outlet glaciers along the southern margin of Vatnajökull ice cap (Figure 4) and Mýrdalsjökull (Figure 5) descend to lowland altitudes below 100 m a.s.l.
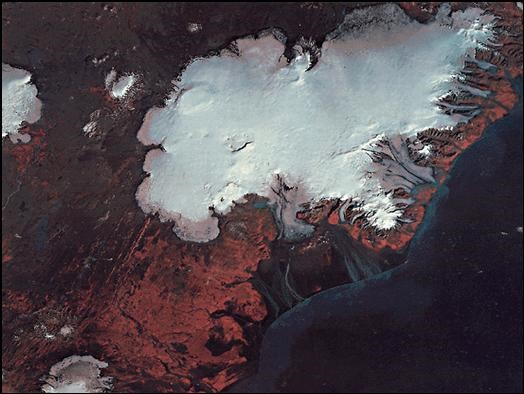
Figure 4. Satellite photo of Vatnajökull. Image courtesy of MODIS Rapid Response Project at NASA/GSFC.

Figure 5. Satellite photo of Mýrdalsjökull ice cap, central South Iceland. Image courtesy of MODIS Rapid Response Project at NASA/GSFC.

Figure 6 : Langjökull (right) and Hofsjökull (left) ice caps in the central highlands of Iceland . Image courtesy of MODIS Rapid Response Project at NASA/GSFC
Most Icelandic outlet glaciers occupy sub-glacial valleys or channels, which in some cases may reach well below the sea level. This is the case of Breiðamerkurjökull, at the southern margin of Vatnajökull, for an example, and explains why the glacial retreat has caused the formation of a glacial lake, Breiðamerkurlón, bordering the glacier (Figure 7).
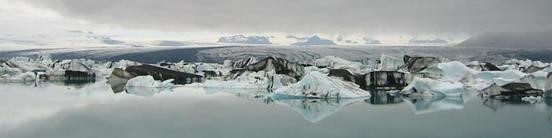
Figure 7 : Breiðamerkurlón.
Sólheimajökull, which is an outlet glacier from the Mýrdalsjökull ice cap (Figure 8), also occupies a basin that reaches some 100 m below sea level a few km inside the present ice margin. It is presently retreating about 100 m/yr, and within a couple of decades (given the present rate of retreat continuing) an ice lake will form in front of the glacier.
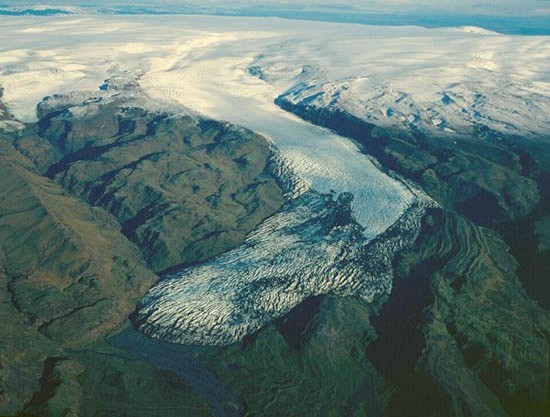
Figure 8. Sólheimajökull, an outlet glacier from the Mýrdalsjökull ice cap. Photographed on the 30th of October 1985. Photograph courtesy of Oddur Sigurðsson.
Although most Icelandic outlet glaciers are confined to valleys and broad subglacial channels, piedmont glaciers also occur on Iceland (Figure 9). These form where outlet glaciers extend onto lowlands outside confined channels.
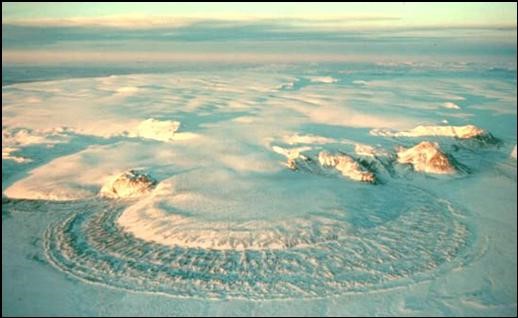
Figure 9. Múlajökull, an outlet glacier from Hofsjökull ice cap in the central highlands of Iceland. Photo courtesy of Oddur Sigurðsson.
In the mountainous highlands of central northern Iceland, there are numerous small cirque glaciers and rock glaciers (Figure 10). The landscape there is characterized by numerous cirques and corries above the main valleys, as well as horns and arêtes.
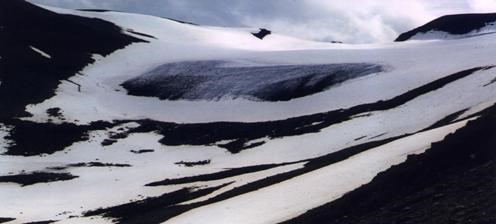
Figure 10. Kambsjökull, a small corrie glacier in the highlands of Flateyjardalsskagi, northern Iceland. Photo taken in 2003, courtesy of Javier Tellaeche Campamelós.
A number of outlet glaciers in Iceland classify as ice falls. An example of this is Gígjökull, which is an outlet glacier from the Eyjafjallajökull ice cap (Figure 11). Icelanders sometimes call this glacier Falljökull, which means Ice Fall Glacier.

Figure 11. Gígjökull, a small outlet glacier from Eyjafjallajökull, southern Iceland. Photo : Ólafur Ingólfsson 2004.
Icelandic glaciers are presently retreating
Glaciers on Iceland had their maximum Little Ice Age extension by 1890-1920. Glacier variations in Iceland since 1930 show a clear response to variations in climate during this period : Most non-surging glaciers retreated strongly during the early half of the monitoring period, following the warm climate between 1930 and 1940. A cooling climate after 1940 led to a slowing of the retreat and many glaciers started to advance around 1970. Warming climate since 1985 led to an increased number of retreating glaciers, and all Icelandic outlet glaciers are retreating presently and the ice caps are loosing ice volumes due to accelerating summer melt (Figure 12). The estimated coverage loss per year is about 0.2% overall, which amounts to 20-30 km2 becoming ice free every year. If the present trend continues, most glaciers on Iceland will have melted away within 200 to 500 years depending of the source. Variations of non-surging glaciers in Iceland since 1930 appear to be caused primarily by variations in temperature as there are no long term variations in precipitation over this period. The warming trend observed for the last three decades of the 20th Century continues until present day. The glacial retreat often exposes beautiful suites of glacial sediments and landscapes, including glacial flutes, drumlins, eskers, hummocky moraine grounds and moraine ridge systems. The Icelandic glacial systems are a natural classroom for students of glacial geology and geomorphology.
| Ice Cap | Area in 1958 | Area in 2000 | Area deglaciated |
| Vatnajökull | 8,538 | 8,160 | 378 |
| Langjökull | 1,022 | 950 | 72 |
| Hofsjökull | 966 | 925 | 16 |
| Mýrdalsjökull | 701 | 590 | 111 |
| Drangajökull | 199 | 160 | 39 |
| Eyjafjallajökull | 107 | 77 | 30 |
| Tungnafellsjökull | 50 | 48 | 2 |
| Þórisjökull | 33 | 32 | 1 |
| Þrándarjökull | 27 | 22 | 5 |
| Tindfjallajökull | 27 | 19 | 8 |
Figure 12. Estimated change in size of Icelandic ice caps, in km2, between 1958 and 2000.
Surging glaciers on Iceland
A surge-type glacier experiences a dramatic increase in flow rate, which can be 10-100 times greater than normal flow rates. The velocities of surge type glaciers can exceed 100 m/day. It is often characteristic for surge-type glaciers to experience a short-lived episode of accelerated flow, which is followed by a period of stagnation or retreat. Surging glaciers typically occur in maritime climates, such as on Iceland, Svalbard and in Alaska. Glacier variations in Iceland have been recorded systematically since the 1930’s. About 50 different outlet glaciers and other types of glaciers are included in the monitoring system for Icelandic glaciers. About 26 Icelandic glaciers are known to surge, among them some of Vatnajökull’s largest outlet glaciers (Figure 13).
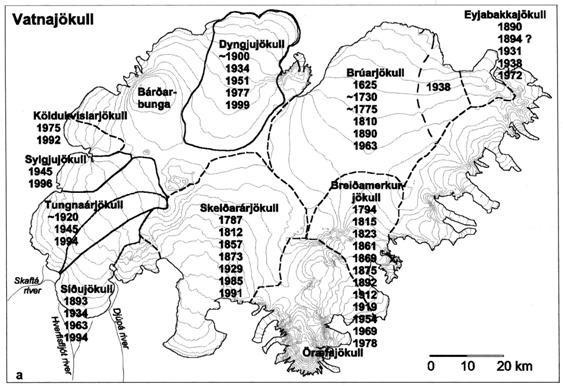
Figure 13 : Major surging glaciers of Vatnajökull. Figure source : Björnsson et al. (2003)
One of the best known Icelandic surging glaciers is Brúarjökull, a major outlet glacier in the north-eastern part of the Vatnajökull system. It had major surges in 1810, 1890 and 1963-64. During the 1890 surge, the ice margin advanced about 10 km over a period of few months (Figure 14). Subsequent to the surge, the ice front became largely stagnant and the glacier retreated until it surged again in 1963-1964. Brúarjökull stands as a textbook example of glacial landsystems created by surging glaciers (Evans and Rea, 2005), and has in recent years been extensively studied for the purpose of understanding causal links and effects of glacial surges.
Figure 14. The large thrust moraines of the Brúarjökull 1890 surge. Photo : Ólafur Ingólfsson, 2004.
Sources
http://all-geo.org/volcan01010/2012...
https://notendur.hi.is/oi/icelandic...
http://www.nnv.is/skrar/DFHM03%20p1...
http://www.hi.is/ oi/bruarjokull_project.htm
http://www.vedur.is/vedurfar/vedurf...
http://danny.oz.au/travel/iceland/j...
Article compiled by Florian Pinchon, educator at Objectif Sciences International (OSI).
Further information
If you are interested by this topic, we organize each year scientific expedition the ICELAND’LAB and school trip.
Visit our web site : www.science-camps.com
More articles in French are also available on this web site.
Suivez notre actualité sur les réseaux sociaux :